Being a visual representation of data, a chart pattern is a key matter to technical analysis, which in its turn, based on its past fluctuations, involves predicting where the market can move next. Thus, it is obvious that binary options charts are a fundamental issue if you want to trade successfully.
As a matter of fact, there are a number of charts that are used to analyze price movements. The most famous and widely used ones include the following: a bar chart, Chinese candlestick charts, line charts, as well as point and figure charts. All of them will be described below, you, keep on reading.
Bars

So, the very first chart, which is the simples one, is a bar chart. The most convenient type of a Bar Chart is called OHLC or open-high-low-close chart. In other words, it is a chart where every single bar represents one point in time. Keep in mind that every bar should reveal the open, low, high, and closing prices.
Lines
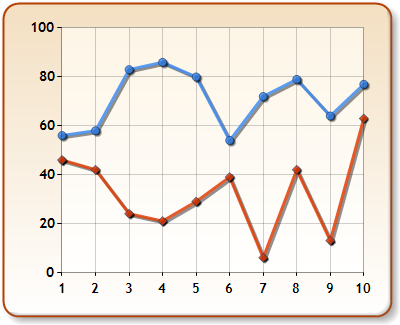
If the data is represented by symbols, for example, lines, we talk about a line chart. Generally speaking, it collects a series of data points together, thus, forming a line. Noteworthy is that line charts, in general, are regarded as the basic type.
Chinese candlestick
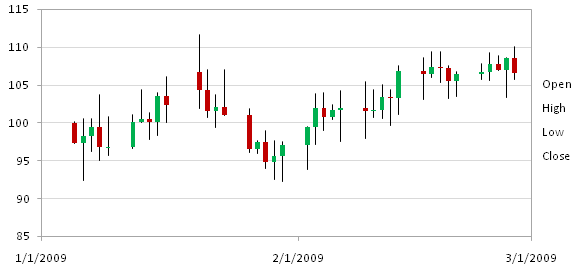
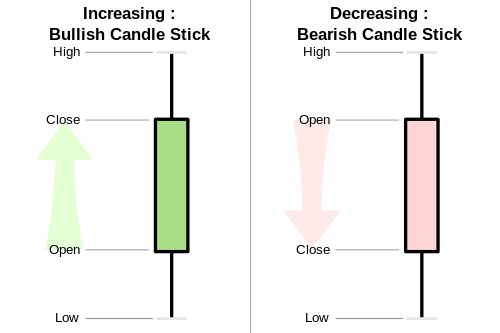
The Chinese candlestick charts belong to an ancient Japanese method of technical analysis. They are, on one hand like bar charts, but, on the other hand, they use a wider bar. What is more, every beginning trader should not forget that candlesticks always show the open, close, high and low prices. If the open is bigger than the close one, the candlestick becomes red. So, in case it proves to be lower than the close, then the bar will become green.
Point and Figure
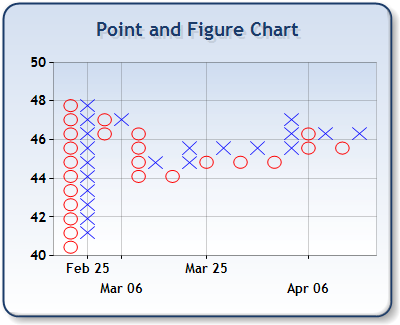
Point and Figure charts (PaFC) are special charts that are not influenced by the time passing. In other words, they don’t depend on time, but they strongly depend on the price change. By the way, PaFC, in general, do not feature price on solemnly y-axis and time on x-axis. In fact, they are made to display price changes on both axes.
It is interesting to mention that in the past, the traders used to draw charts by hand. Thus, it is obvious that charts had to be updated on a regular basis. Today, it is the computer that can easily make any time frame charts within seconds, in a few clicks.
To sum up, the line and bar charts may be regarded as the basic form of charts, whilst candlesticks are far more advanced and, what is why, they can even reveal stories that are not detected with other charts. When it comes to point and figure charts, they rather involve the price change, and do not depend on time. However, knowing the mentioned above issues is not enough to become a successful chartist. You should also know and really understand such issues as binary options indicators, oscillators, and trends.